
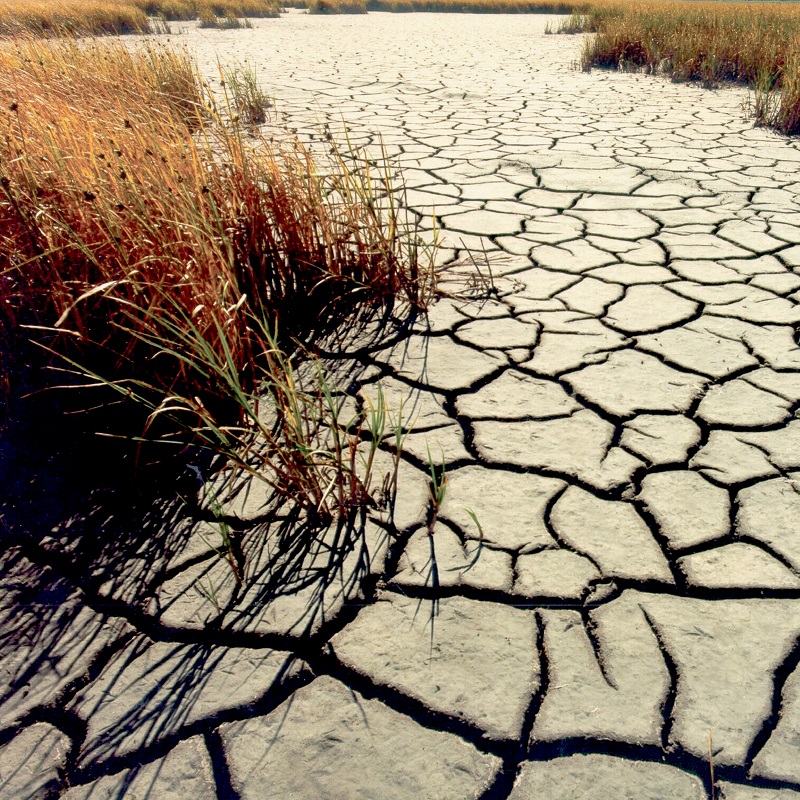
The U.S. Geological Survey California drought visualization website provides data on the severe drought conditions through maps, charts, and graphs. Photo courtesy of the U.S. Geological Survey.
In response to one of the most severe droughts in U.S. history, primarily affecting California, the U.S. Geological Survey (USGS) has released the California drought visualization website. The website presents drought data through maps, graphics, and charts, helping to relay the conditions of the area’s rivers, streams, lakes, and reservoirs, according to a USGS news release.
By navigating the Web page, users can see the effect of the drought since 2011. The website shows how reservoir levels respond to seasonal drivers but also how the overall available water levels have been decreasing. An interactive display shows the connection between snowpack and reservoir levels. Current streamflow data collected at USGS gauging stations is compared to historic averages. The website also provides a summary of California’s water use profile, the news release says.
The U.S. Geological Survey monitors drought conditions across the country and provides resources such as the California drought visualization website and Vegetation Drought Response Index to the public. Photo courtesy of the U.S. Geological Survey.
“USGS is determined to provide managers and residents with timely and meaningful data to help decision-making and planning for the state’s water resources,” said Nate Booth, chief of USGS Water Information, in the release. “The drought affects streamflow across the state, which leads to reduced reservoir replenishment as well as groundwater depletion.”
USGS developed the website as part of the federal government’s Open Water Data Initiative. This initiative has the goal of improving access to data and enabling open exchange of water information and provides both the public and water resource managers with atlas coverage of the drought, a timeline of its effects on water resources, and an outline of water use and changes in the water cycle. The analytical, graphical, and software tools used for the website are open-source and available for reuse, according to the news release.
“Ultimately, the initiative will allow us to better communicate the nation’s water resources status, trends, and challenges based on the most recent monitoring information,” said Mark Sogge, USGS Pacific regional director, in the release.
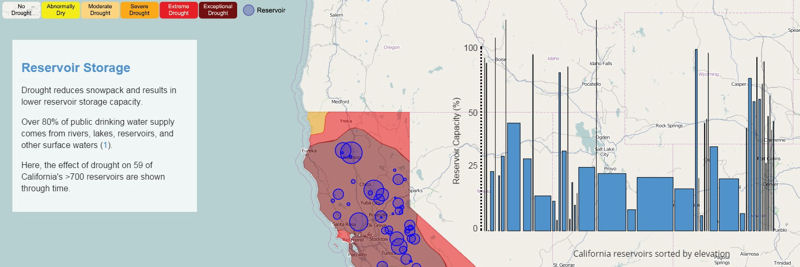
The drought visualization website visuals relay information on the reservoir storage levels in California. Photo courtesy of the U.S. Geological Survey.
California is experiencing one of the most severe droughts in the state’s 119 years of recording its water history. California Governor Jerry Brown has declared a state of emergency and issued an executive order mandating a 24% reduction in water use to help mitigate the effects. In addition to the visualization website, the USGS California Water Science Center created the USGS California Water Science Center webpage, an extensive portal dedicated to sharing information about the drought.
— Jennifer Fulcher, WEF Highlights


April 16, 2015
Featured, Multimedia